
Platform
Call Center
Get Started
Wanna subscribe to our blog?
Get updates once a month.
Platform
Call Center
Solutions
Get Started
Wanna subscribe to our blog?
We'll send you updates once a month.


How can you tell if your company actually offers great customer support?
It's one of those things that every business focuses on and wants to consistently get better at - most even believe they do it well. Support teams consistently focus on ways to improve performance by tweaking call scripts and coaching reps on how to effectively listen and respond to customers.
But here's the problem - people still hate calling companies to get over-the-phone help.
Despite a company's best intentions, the idea of calling support teams makes people think of long wait times, multiple call transfers, and having to repeat basic information several times.
So what do you do if you want your CS team to be an exception?
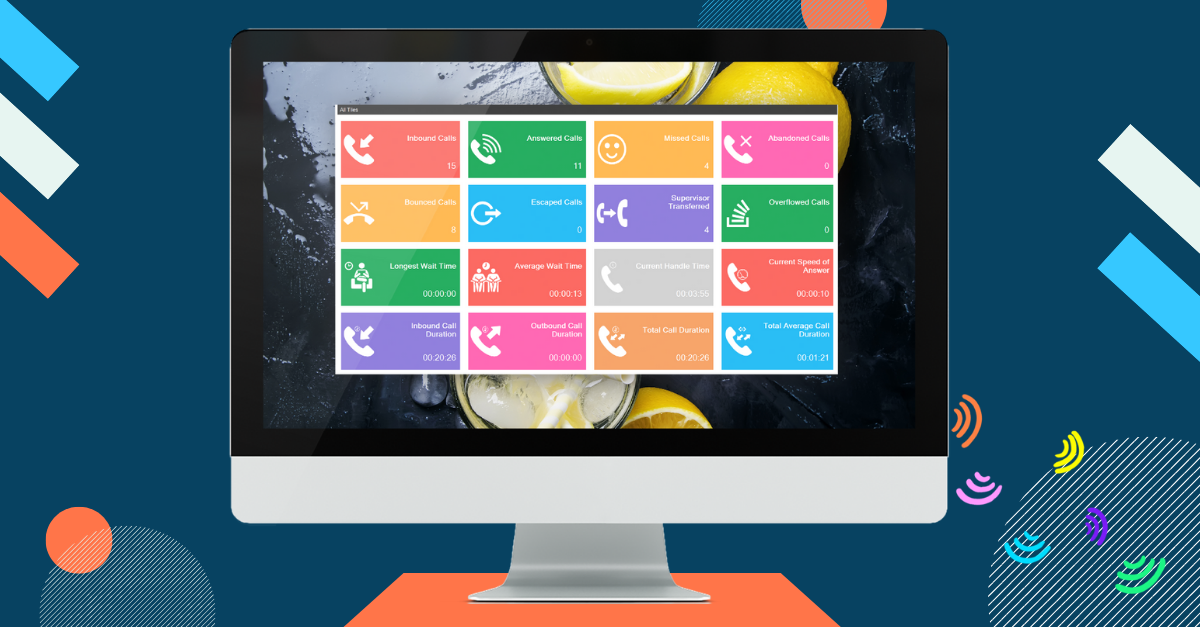
Start with your call center metrics.
Effective customer support needs to become a part of your growth strategy if it hasn't already. At this point, most businesses are familiar with the fact that it's much more expensive to acquire new customers than it is to retain existing ones.
But today, that goes a step further. Great support is a crucial part of overall customer experience, and is usually one of the aspects of your business that determines how likely your customers are to refer you to friends and colleagues. That likelihood is called your Net Promoter Score (NPS) - it's the single most useful metric for measuring customer experience and something that can drive some serious word-of-mouth business.
Related Post: 4 Customer Experience Metrics That Can Help You Build Brand Loyalty
If your customer support isn't responsive or effective, you're seriously hurting the chances of your customers recommending you to someone else. Luckily, the usual gripes that customers have with phone-based support (long waits, dead-end conversations etc.) can be identified through KPIs.
Here are 5 call center metrics that'll help you get started.
The easiest way to tell whether your customers are waiting on hold too long is to measure how quickly your team is answering their calls. It sounds simple enough, but that's what makes it so easy to overlook - especially in a call center environment.
To figure out your call center's ASA, simply take the total wait time for answered calls and divide it by the number of calls your team answered.
%20Updated.png)
So if a group of customers waited for 100 minutes for 25 answered calls, then your ASA is 4 minutes.
This is a call center metric that allows you to quickly determine if you have a "customer on hold" problem. Given that being stuck on hold is almost always indicative of a poor experience, it's a good idea to make sure that this number is as low as possible before reviewing other call center metrics.
Here's another one you want to keep as low as possible.
Call Abandon Rate simply refers to the number of customers that give up on receiving phone-based support before speaking with a company rep.
And as most of us know, there are very few things more frustrating than calling an organization for support, sitting on hold for too long, and deciding to give up on the call. I'm looking at you, DMV.
Abandon rate is referenced as a percentage of the total number of calls your support team receives. At it's most basic, it's calculated by subtracting the number of calls your reps answered from the number of calls they received, then dividing by the total number of calls.
However, it's also important to account for calls that are quickly abandoned because someone dialed the wrong number or transferred themselves to the wrong department using your auto-attendant. Those weren't necessarily "abandoned."
To help account for this, let's assume that calls that were hung up within 5 seconds were probably some type of mistake. That leaves us with this:
.png)
This metric goes hand-in-hand with your ASA. Together, they allow you to understand how long customers are willing to wait before getting someone on the phone. Finding the right balance here can help you staff your call center appropriately based on peak activity hours.
Your Transfer Rate is the percentage of calls that reps transfer, whether it's to escalate a support ticket or move it to a different department. It's a great indicator of Customer Experience, as well as the effectiveness of your reps.
Customers who need to repeat their issue or account information quickly become frustrated. Look at this from your perspective. If you have to listen to the same on-hold music 3 times and repeat your account information each time you speak with someone new, you probably wouldn't have a positive impression of your experience.
To calculate Transfer Rate, divide the number of handled calls that are transferred by the total number of calls your reps handled over a selected time period. (Also, be sure not to count calls that are automatically routed/transferred by an IVR/auto-attendant.)
.png)
This call center metric also provides some insight on the effectiveness of your support reps. If an individual rep consistently has low transfer rates, you can use their knowledge and techniques to help establish best practices across your team.
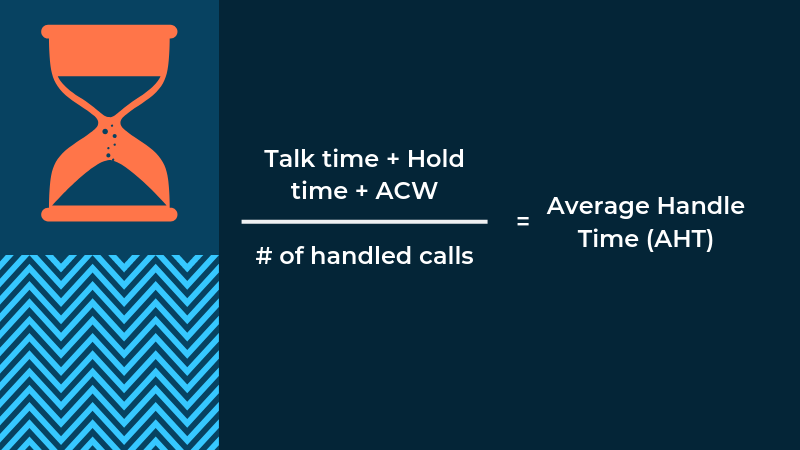
Average Handle Time refers to the average amount of time it takes for a rep to complete a call, including talk time, time on hold, and time spent performing after-call work (updating customer records, writing notes, sending follow up emails etc.)
AHT is commonly used to measure the efficiency of reps and the support organization as a whole. Similar to the metrics mentioned above, keeping this number low can go a long way towards enhancing the experience that customers have with your support group.
To get this average, add up total talk time, hold time, and the time it takes for reps to complete their after-call work. Once you have that number, divide by the total number of calls your team handled over a specified time period.
AHT is a useful metric to gauge efficiency, but it can't tell you how effective your reps are by itself. Using it as an incentive can be tricky, because the last thing you want is for reps to rush customers off the phone before they feel comfortable just to keep their AHT low.
That's why this next metric is especially helpful.
By this point, it probably feels like the moral of this post is that the faster that support interactions are, the happier customers will be.
But that's only true to a point.
Improving support efficiency should always be a goal, but quicker resolution times can't come at the cost of your customers' comfort. If customers feel like their issues aren't being resolved (or at least thoroughly addressed), you have a problem.
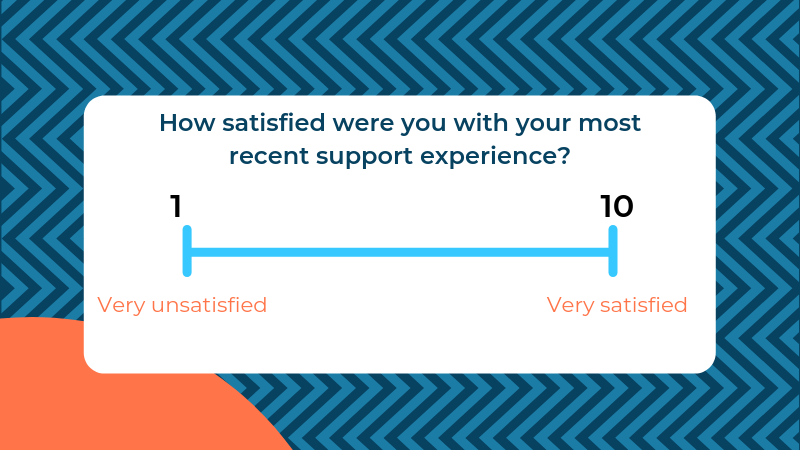
That's why you need to measure Customer Satisfaction Score (CSAT). It's a quick and easy way to gauge how your customers feel after every support interaction, regardless of how long it took.
Ask. CSAT scores are measured by simply asking customers how satisfied they are, usually on a 5 or 10-point scale.
To apply this to your support team, just send out a quick email after every completed support interaction asking customers how it went.
When you compare your CSAT score to your speed-related metrics, you can quickly get a sense for how your team is doing.
Typically, CSAT and the other KPIs mentioned above will have an inverse relationship - the faster you resolve issues, the happier your customers will be. If you notice that they start moving together, you'll know that something needs to be tweaked. If your CSAT score is decreasing alongside your response and handle times, you'll know that support reps probably aren't being as thorough and helpful as they should be.
But by finding the right balance between CSAT and the rest of your metrics, you can ensure that your teams are as running as smoothly and effectively as they can be. And when you find the right balance between speed and effectiveness, your customers reap the rewards.


No Comments Yet
Let us know what you think