Platform
Call Center
Get Started
Wanna subscribe to our blog?
Get updates once a month.
Platform
Call Center
Solutions
Get Started
Wanna subscribe to our blog?
We'll send you updates once a month.
Wanna subscribe to our blog?
Get updates once a month.
Wanna subscribe to our blog?
We'll send you updates once a month.

If you're running a phone-based support team, there's a good chance you're tasked with meeting specified performance metrics. Companies that are serious about creating effective and memorable support experiences usually take the time to establish KPIs for their teams, which correlate with how quickly and effectively customer support issues are being resolved.
By tracking how fast calls are being answered, how long conversations last, and how many callers are hanging up before reaching a rep, support call center admins can tell what their teams are doing well and what needs improvement.
But if you're a support leader, sifting through call center data can be extremely time-consuming. Not to mention, if you don't readily have access to performance data, you can't make decisions that positively impact Customer Experience (CX) on the fly.
This is where call center dashboards come in.
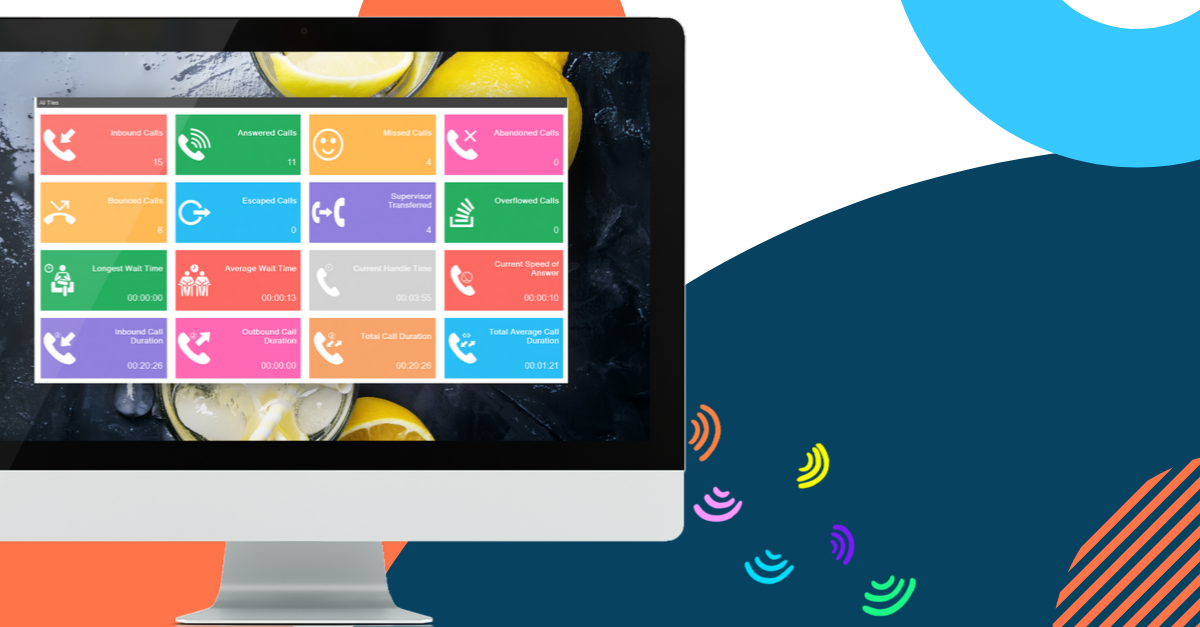
Dashboards give your support reps and admins the ability to view call center performance at a glance. Wallboards displayed on monitors and TVs help support teams consume information, monitor trends, and make adjustments based on real-time performance against KPIs.
To deliver great customer experiences, you need to make sure your reps have performance benchmarks. By focusing on KPIs like Average Speed of Answer (ASA) and Average Handle Time (AHT), you can train reps more effectively and fine-tune their skills so they can handle customer needs better.
Ideally, this type of training should also happen in real time, which is why it helps to have live data to refer to - especially when it comes to new reps. For example, if a support manager notices that an agent is having unusually long calls, they can remove them from the queue and work with them to make improvements. By doing so, they're not only helping the rep get better, they're reducing hold times for customers too.
Admins can also see how many calls support reps are answering, which provides insights about the amount of time that's being spent on After Call Work (ACW) by a given rep.
Call center dashboards also provide a snapshot of how your support team is performing on a given day. When it comes to handling incoming support calls, it's important to keep track of how much time customers are spending on hold before reaching a rep, how much time they're spending on the phone once they do, and how many customers decide to abandon the process because it's taking too long.
Wallboards provide a real-time view of key support metrics like Average Handle Time (AHT), Average Hold Time, and Abandonment Rate.
If you're a call center admin, being able to track these metrics helps to make quick adjustments. Support managers can make routing changes, and decide to make staffing adjustments if they notice trends in call volume and hold times over time.
Call center dashboards help support leaders gain a quick understanding of how their phone-based teams are performing, down to the individual rep level. Wallboards provide insights that help with staffing and training, and the ability to view KPIs in real-time allows for faster decision-making, quicker resolutions, and better experiences for customers.
To learn more about Call Center Dashboards, check out our webinar below!
These Stories on Customer Experience
No Comments Yet
Let us know what you think